Retail Footfall Analytics: How to Compare Multiple Stores Fairly
TL;DR: Retail footfall analytics for multiple stores compares defined visit events across branches using compatible counting rules, reporting periods and operational context. Agree a common counting and entrance-coverage contract. A normalised traffic rate does not automatically make different stores equivalent or establish why their sales differ.
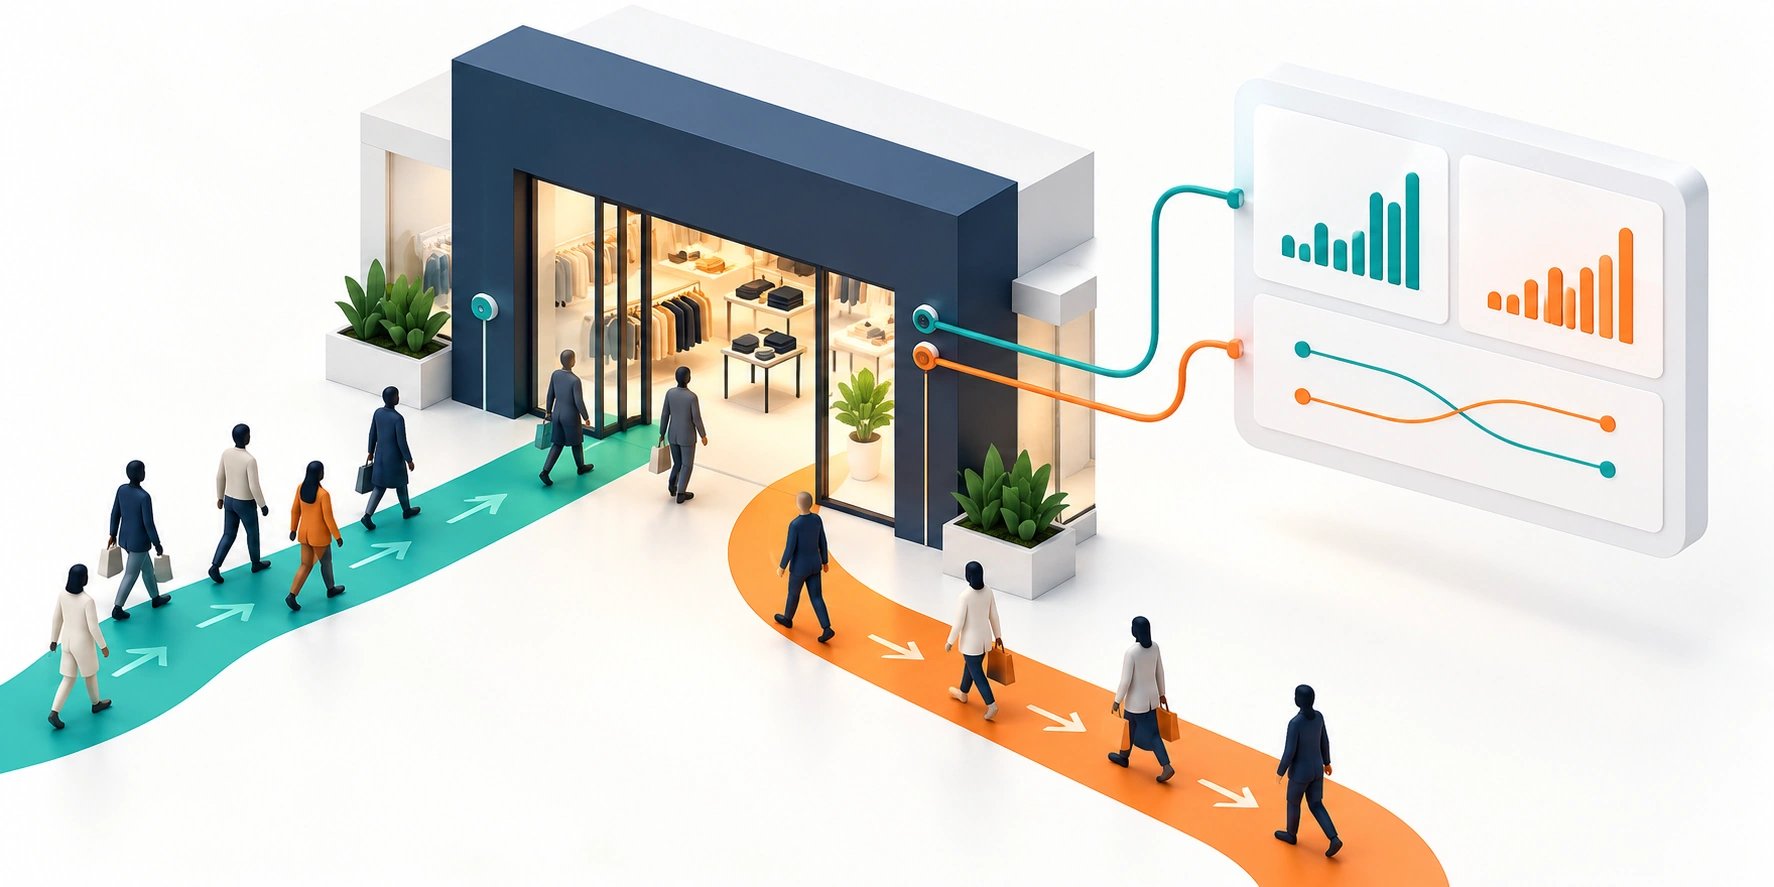
Original AI-generated editorial illustration; it depicts a concept rather than a client deployment or product screenshot.
Introduction
Comparing branch traffic looks simple until one store counts two entrances, another loses camera coverage and a third changes opening hours. Multi-store reporting needs a common measurement contract. Retail teams should make those differences visible before treating a league table as evidence of branch performance. Here is how to evaluate retail footfall analytics against that business need.
What Is retail footfall analytics?
Retail footfall analytics for multiple stores compares defined visit events across branches using compatible counting rules, reporting periods and operational context.
Different entrance coverage can invalidate a branch comparison. Downtime and opening hours change the observation window. Counts and transactions require separate definitions before combining them.
A normalised traffic rate does not automatically make different stores equivalent or establish why their sales differ. The scope should make this distinction clear before the team commits to a solution.
Technical context: OpenCV documents motion estimation and tracking of image features across video frames. OpenCV: Optical flow and motion analysis
Why retail footfall analytics Matters
- Different entrance coverage can invalidate a branch comparison.
- Downtime and opening hours change the observation window.
- Counts and transactions require separate definitions before combining them.
How to Evaluate and Implement retail footfall analytics
Create a shared measurement contract
Define which entrances each branch covers, the crossing rule and the handling of staff and repeat activity. Keep visits separate from unique people. Record installation and configuration changes with effective dates. A branch with several monitored entrances should not be compared directly with one partially monitored doorway. Agree which differences can be normalised and which make the periods unsuitable for comparison.
Make coverage and context visible
Show observed hours, downtime and material changes in store operations beside the count. Compare equivalent periods where possible and annotate promotions, closures and unusual events. Do not replace missing intervals with zero traffic. Normalising by observed opening time may help a specific analysis, but it does not remove differences in store format, catchment or counting quality. Retain raw measures so the calculation can be inspected.
Use branch comparisons as questions to investigate
A changed branch pattern can guide a staffing or service discussion without explaining its cause. Align transaction reporting only after finance and operations agree what each event measures. Show uncertainty and data gaps instead of ranking every store with false precision. Review privacy and access arrangements for the actual deployment. Where aggregate information answers the question, do not add identity collection merely to make a comparative dashboard appear more detailed.
Compare the available approaches
| Approach | Suitable starting point | Main limitation or responsibility |
|---|---|---|
| Raw entry total | Within one stable counting setup | Coverage and hours may differ |
| Rate per observed period | A defined normalised comparison | Does not remove store-context differences |
| Transactions alongside counts | Explore compatible operational patterns | Not proof of causation or unique visitors |
A practical example
A hypothetical chain compares entry activity across three branches. One branch extends opening hours, another has an unmonitored entrance and a third loses two reporting intervals. The dashboard separates compatible periods and flags incomplete coverage. Managers review staffing questions using those limits rather than declaring the busiest-looking branch the best-performing store. This is an illustrative reporting design, not a claimed sales or accuracy result.
An acceptance test worth running
Count a sampled period with groups, repeat entries and staff movement, then compare the recorded crossings with the agreed definition. Disconnect the camera and confirm that the reporting period is marked incomplete. Review transaction comparisons using aligned store hours. The dashboard should help managers reason about activity without labelling anonymous crossing events as known unique customers.
What to measure
Track observation coverage, comparable reporting periods, count-quality checks and the usefulness of manager decisions arising from the comparison.
Use a representative baseline and record the conditions of the comparison. Agree who reviews failures and what evidence is needed before expanding the scope. For a broader view of the related delivery work, explore Webbies services.
Practical Steps for retail footfall analytics
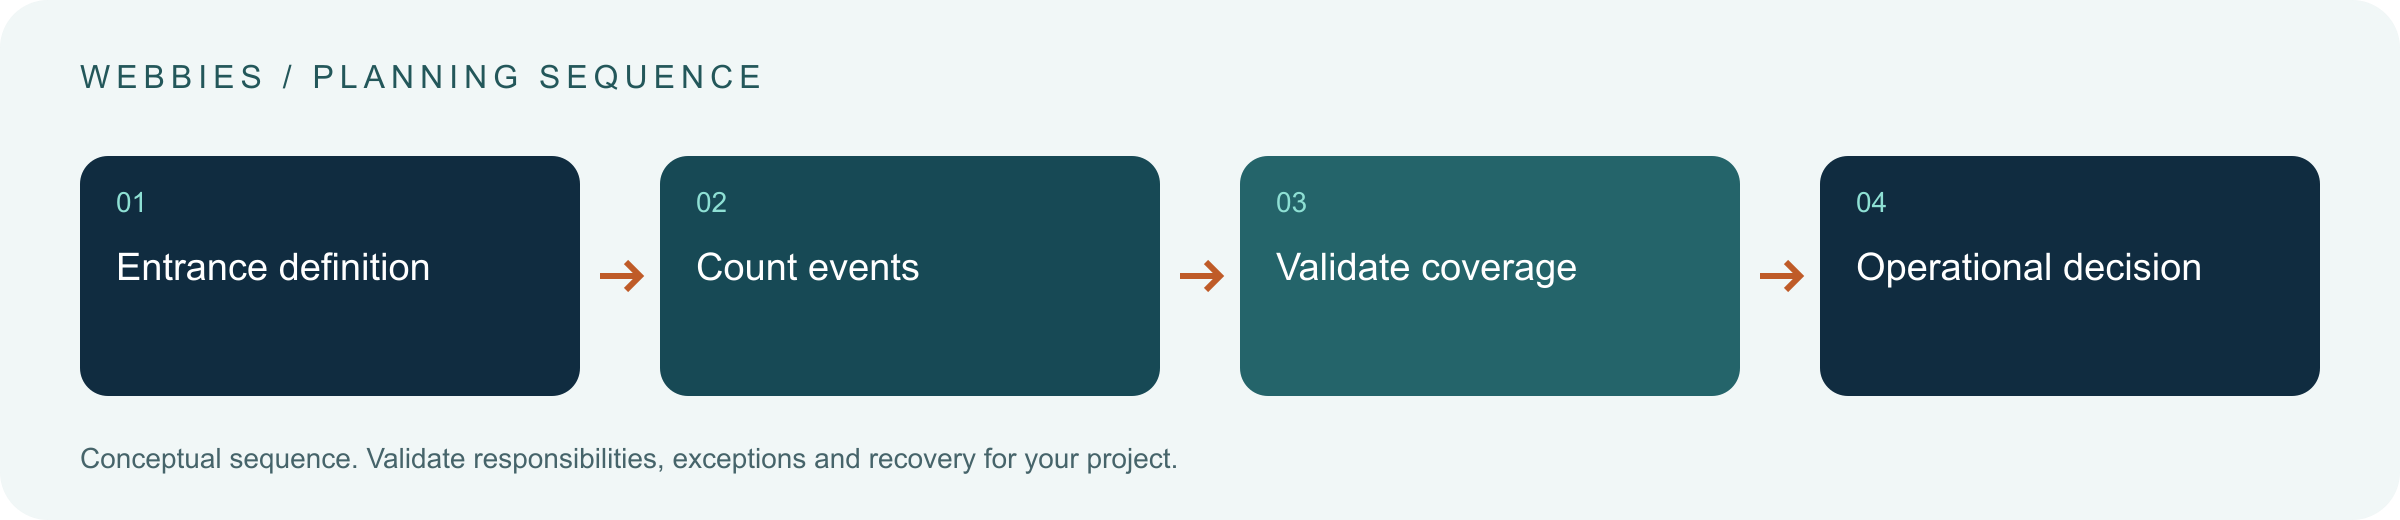
- Agree a common counting and entrance-coverage contract.
- Record operating hours, downtime and configuration changes.
- Compare compatible periods with transparent calculations.
- Review outliers with store managers before drawing conclusions.
Prepare a useful project brief
| Decision | What to establish |
|---|---|
| Audience | multi-store retail operations teams comparing branch activity |
| First boundary to agree | Agree a common counting and entrance-coverage contract. |
| Evidence of useful performance | Track observation coverage, comparable reporting periods, count-quality checks and the usefulness of manager decisions arising from the comparison. |
| Estimate dependency | Branch layout variation, existing counter access, historical data quality and reporting integrations determine the comparison effort. |
Bring sample inputs and an example of an exception to the first discussion. Separate confirmed requirements from assumptions, and identify who can supply missing information. The brief should let a delivery team explain what it needs to investigate before making a detailed commitment.
Common Mistakes to Avoid
- Ranking branches with incompatible entrance coverage.
- Treating unobserved intervals as zero traffic.
- Claiming a count explains why a branch sold more.
Frequently Asked Questions
What does retail footfall analytics mean in a business project?
Retail footfall analytics for multiple stores compares defined visit events across branches using compatible counting rules, reporting periods and operational context.
How should a team begin evaluating multi-store footfall comparison?
Agree a common counting and entrance-coverage contract. Record operating hours, downtime and configuration changes.
How do we measure whether branch visitor-count reporting is useful?
Track observation coverage, comparable reporting periods, count-quality checks and the usefulness of manager decisions arising from the comparison.
What affects the cost or timeline of retail footfall analytics?
Branch layout variation, existing counter access, historical data quality and reporting integrations determine the comparison effort. A delivery estimate should follow a review of these dependencies.
What is a common misconception about retail footfall analytics?
A normalised traffic rate does not automatically make different stores equivalent or establish why their sales differ.
Conclusion
Comparable store reporting starts with compatible counting rules and visible context. A branch ranking is useful only when managers understand what its inputs can and cannot establish. Plan a retail-counting pilot with Webbies.
Sources and further reading
- OpenCV: Optical flow and motion analysis — primary technical reference, checked during research on 30 October 2026.
Discuss your project
Plan a retail-counting pilot. Share the current workflow, intended users, existing systems and the decision you need to make; the next step can be a 20–30 minute discovery discussion.