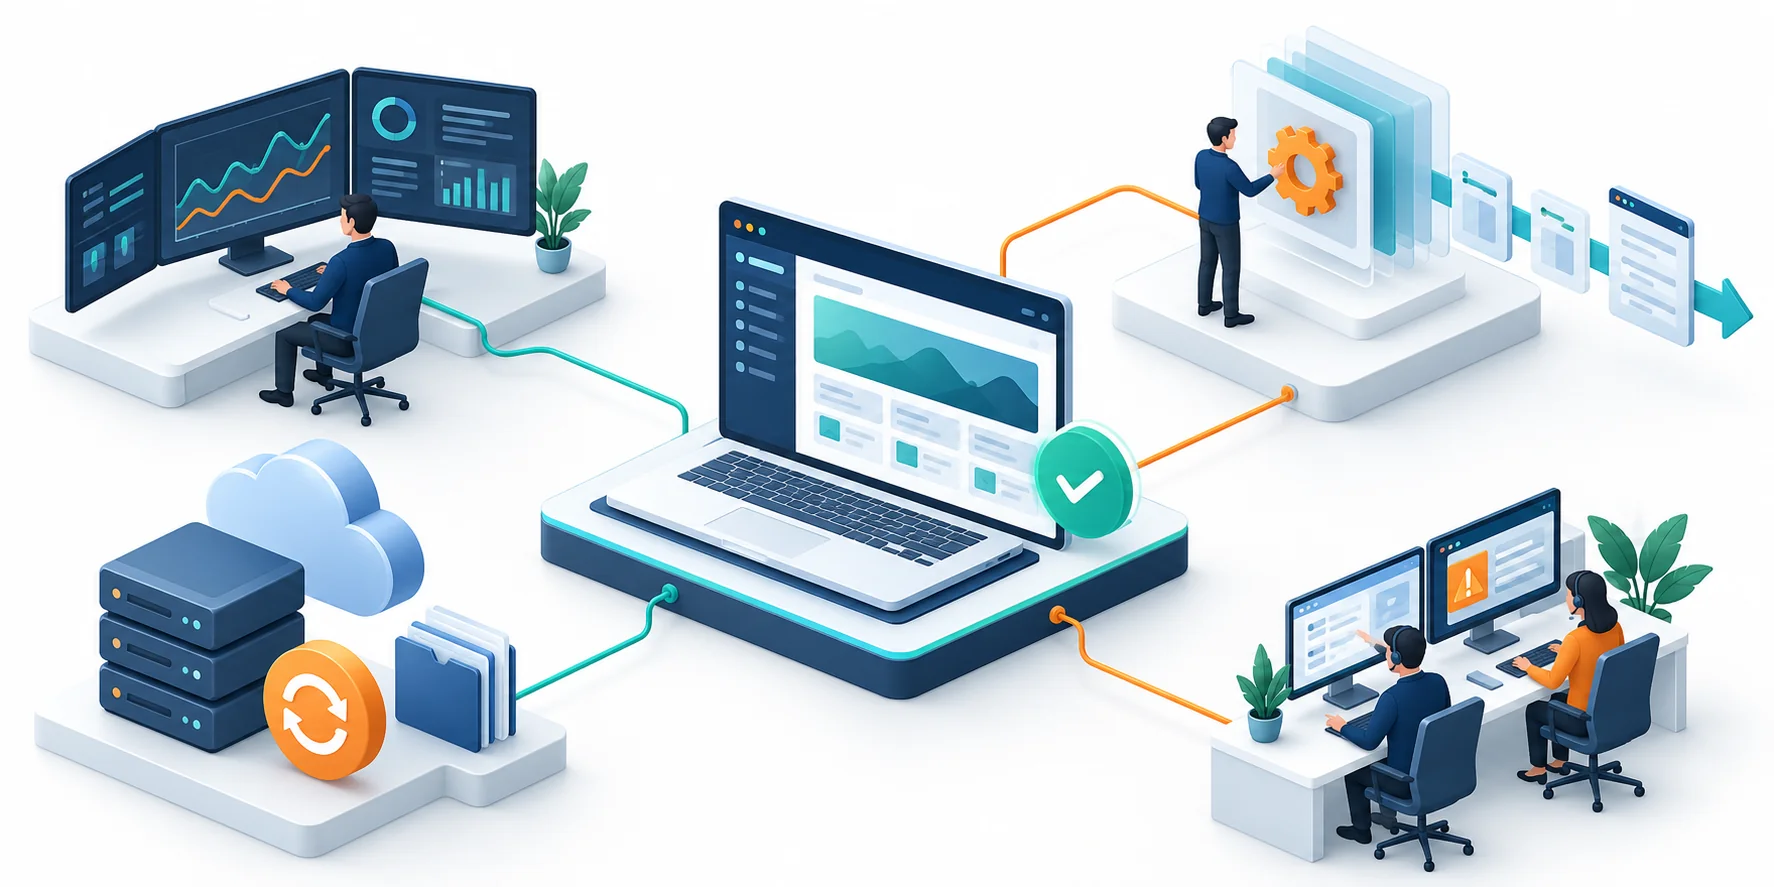
IoT Dashboard: Design Device Data for Operators and Managers
TL;DR: An IoT dashboard presents device observations, status and selected controls in an interface designed for the people operating or overseeing connected systems. Define users, decisions and response ownership. More charts do not necessarily create more useful operational visibility; state and response clarity matter.
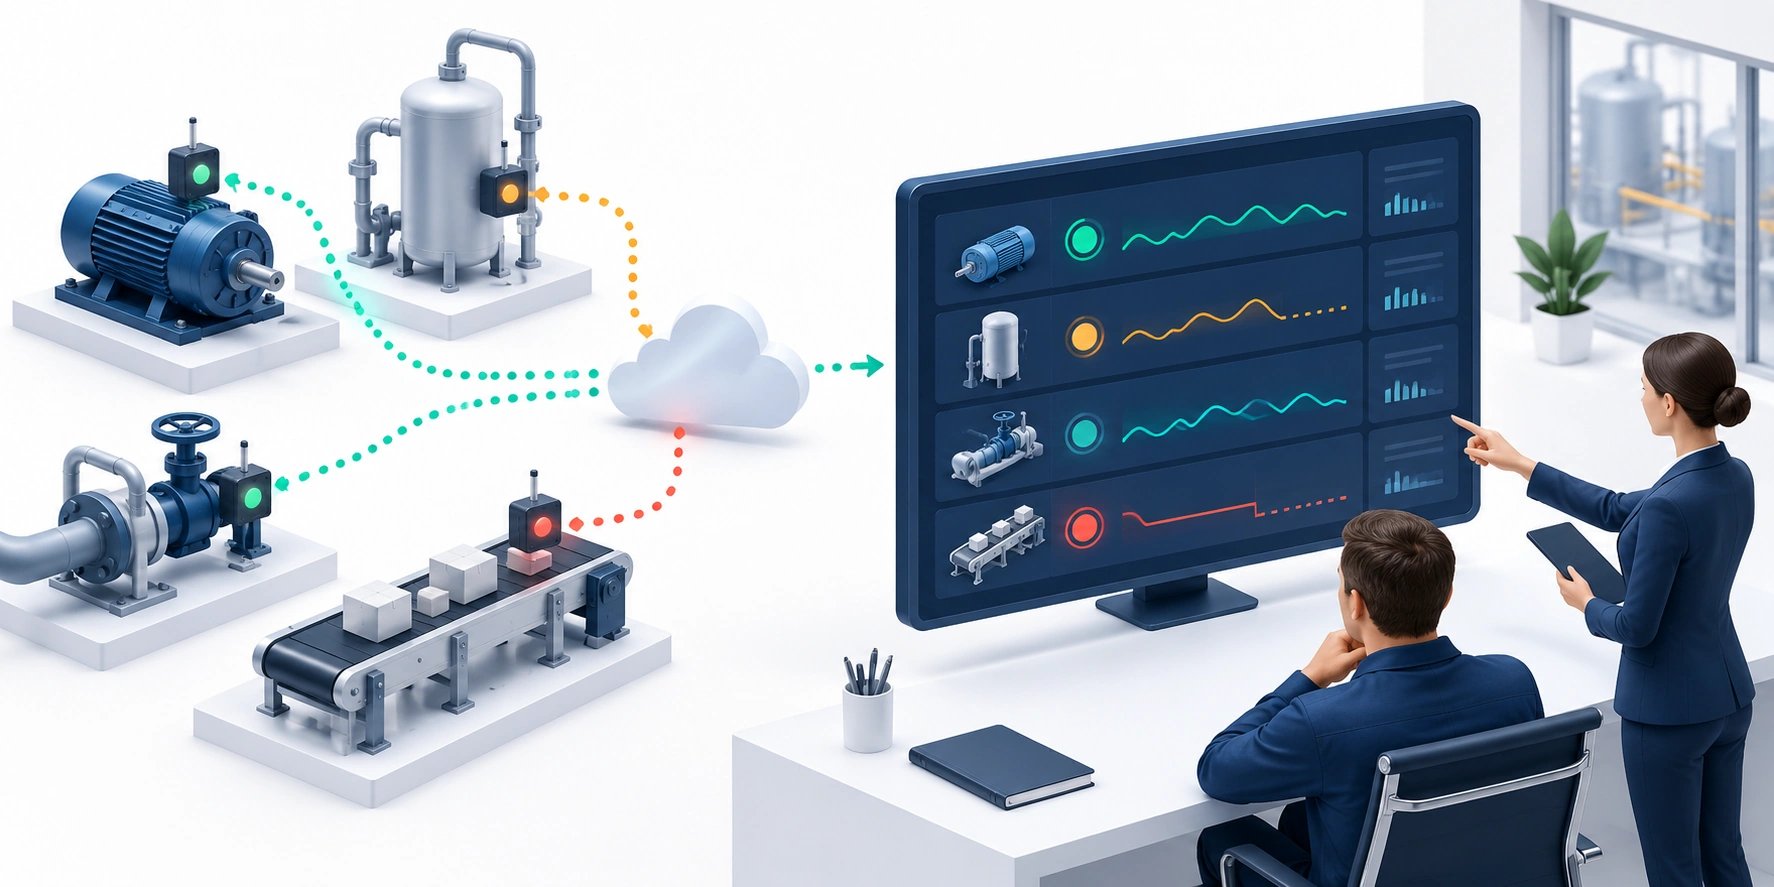
Original AI-generated editorial illustration; it depicts a concept rather than a client deployment or product screenshot.
Introduction
A dashboard can show a sensor value without explaining whether it is current, reliable or actionable. Operators need to distinguish normal operation, stale data and an actual exception. Begin with the decisions the screen supports and the person responsible for responding to each state. Here is how to evaluate IoT dashboard against that business need.
What Is IoT dashboard?
An IoT dashboard presents device observations, status and selected controls in an interface designed for the people operating or overseeing connected systems.
Last-known values can be mistaken for live readings. Operators and managers need different levels of detail. Remote commands require acknowledgement and authority.
More charts do not necessarily create more useful operational visibility; state and response clarity matter. The scope should make this distinction clear before the team commits to a solution.
Technical context: AWS distinguishes requested and reported device state through its Device Shadow model. AWS IoT: Device Shadow service
Why IoT dashboard Matters
- Last-known values can be mistaken for live readings.
- Operators and managers need different levels of detail.
- Remote commands require acknowledgement and authority.
How to Evaluate and Implement IoT dashboard
Define freshness and quality
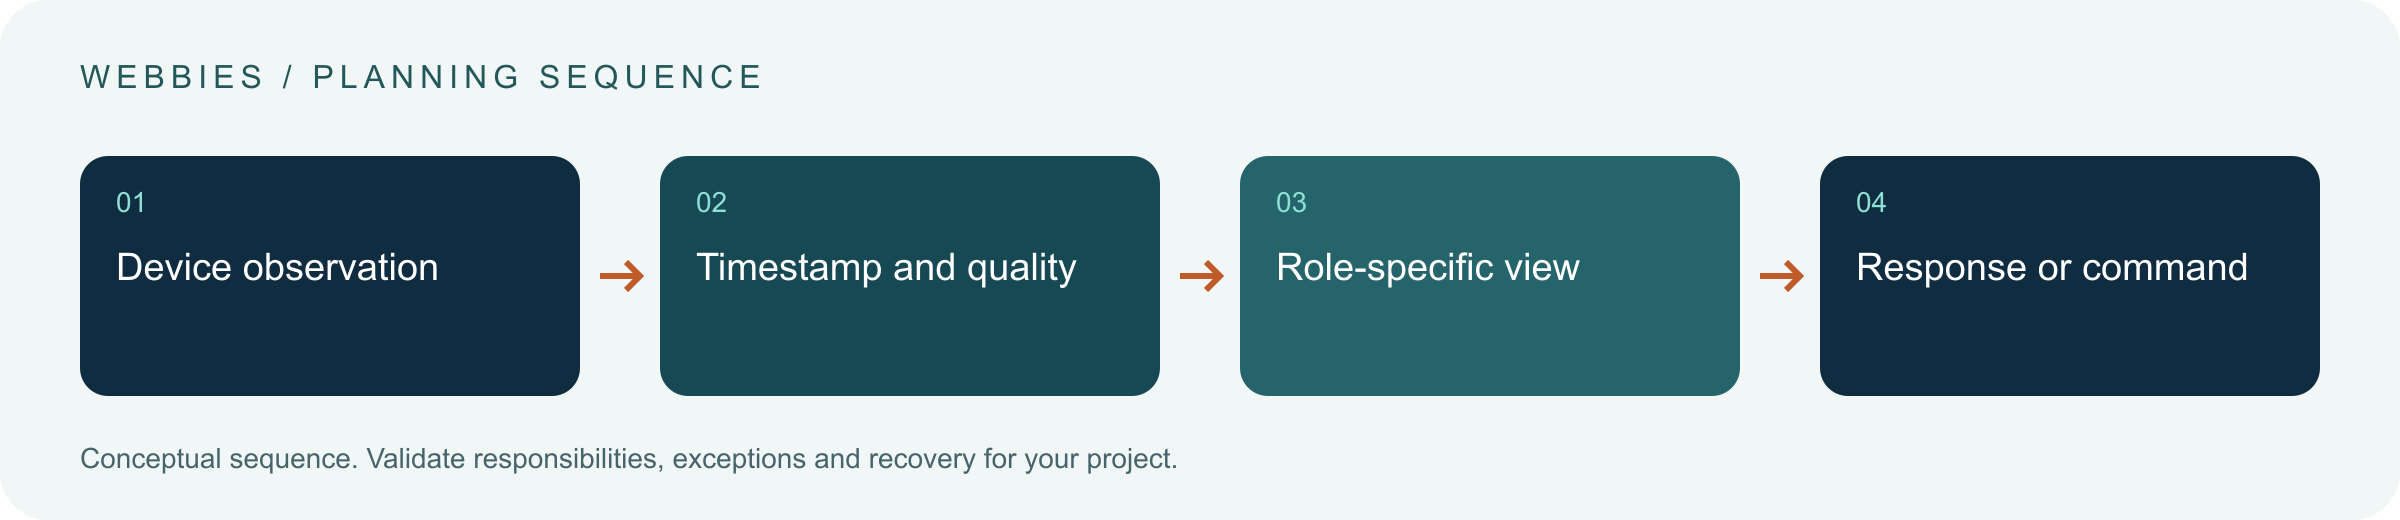
Attach timestamps, units and device identity to observations. Separate event time from receipt time. Show stale, offline and invalid states explicitly, and avoid displaying a last-known reading as live. Decide which gaps can be interpolated for analysis and which must remain visible. The meaning of missing data should be established with operations before it becomes a charting choice.
Design around response roles
Identify the operator's immediate task and the manager's review needs. Prioritise actionable status, clear alarm reasons and the next responsible person. Avoid decorating the interface with every available sensor stream. Summaries should preserve the ability to inspect relevant detail. Test the screen in its actual environment, including viewing distance, shift conditions and the device used to access it.
Keep commands distinct from observations
A requested setting is not a confirmed device state. Show pending, acknowledged and failed commands separately. Apply authorisation and appropriate confirmation outside display logic. Do not imply that a general dashboard replaces specialist safety controls. Maintain device and configuration history so an incident can be traced. Test reconnects and delayed messages rather than relying on one uninterrupted live demonstration.
Compare the available approaches
| Approach | Suitable starting point | Main limitation or responsibility |
|---|---|---|
| Telemetry chart | Historical observations | Can hide stale or missing data |
| Operator dashboard | Current status and response | Needs clear priorities |
| Control interface | Authorised commands | Needs acknowledgement and safe boundaries |
A practical example
A hypothetical factory dashboard shows equipment data with the last observation time and a separate connection indicator. A remote setting remains pending until the device reports the new state. Managers can inspect trends, while operators see current exceptions and response ownership. The example illustrates software behaviour without claiming turnkey manufacturing or safety-system capability.
An acceptance test worth running
Delay a sensor message, disconnect a device and request a setting change. Check that the interface distinguishes last-known observations, missing connectivity and pending commands. Restore the device and verify acknowledgement. Ask an operator to identify the next action from the screen. If the person must infer freshness from a chart's shape, the state presentation needs improvement.
What to measure
Track freshness visibility, useful alert handling, command acknowledgement and operator task completion.
Use a representative baseline and record the conditions of the comparison. Agree who reviews failures and what evidence is needed before expanding the scope. For a broader view of the related delivery work, explore Webbies services.
Practical Steps for IoT dashboard
- Define users, decisions and response ownership.
- Specify units, timestamps and data-quality states.
- Separate requested commands from reported state.
- Test outages, delayed messages and operational usability.
Prepare a useful project brief
| Decision | What to establish |
|---|---|
| Audience | operations teams building connected-device visibility |
| First boundary to agree | Define users, decisions and response ownership. |
| Evidence of useful performance | Track freshness visibility, useful alert handling, command acknowledgement and operator task completion. |
| Estimate dependency | Device protocols, data volume, command authority, historical retention and site requirements determine scope. |
Bring sample inputs and an example of an exception to the first discussion. Separate confirmed requirements from assumptions, and identify who can supply missing information. The brief should let a delivery team explain what it needs to investigate before making a detailed commitment.
Common Mistakes to Avoid
- Labelling cached values live.
- Showing every metric without a decision purpose.
- Treating a sent command as confirmed execution.
Frequently Asked Questions
What does IoT dashboard mean in a business project?
An IoT dashboard presents device observations, status and selected controls in an interface designed for the people operating or overseeing connected systems.
How should a team begin evaluating industrial IoT dashboard?
Define users, decisions and response ownership. Specify units, timestamps and data-quality states.
How do we measure whether device monitoring interface is useful?
Track freshness visibility, useful alert handling, command acknowledgement and operator task completion.
What affects the cost or timeline of IoT dashboard?
Device protocols, data volume, command authority, historical retention and site requirements determine scope. A delivery estimate should follow a review of these dependencies.
What is a common misconception about IoT dashboard?
More charts do not necessarily create more useful operational visibility; state and response clarity matter.
Conclusion
An IoT dashboard should distinguish observation, freshness and confirmed control. Give each user enough context to take the next appropriate action. Design an actionable IoT dashboard with Webbies.
Sources and further reading
- AWS IoT: Device Shadow service — primary technical reference, checked during research on 30 October 2026.
Discuss your project
Design an actionable IoT dashboard. Share the current workflow, intended users, existing systems and the decision you need to make; the next step can be a 20–30 minute discovery discussion.