
Case study Websites
All projectsPEP Annual Report
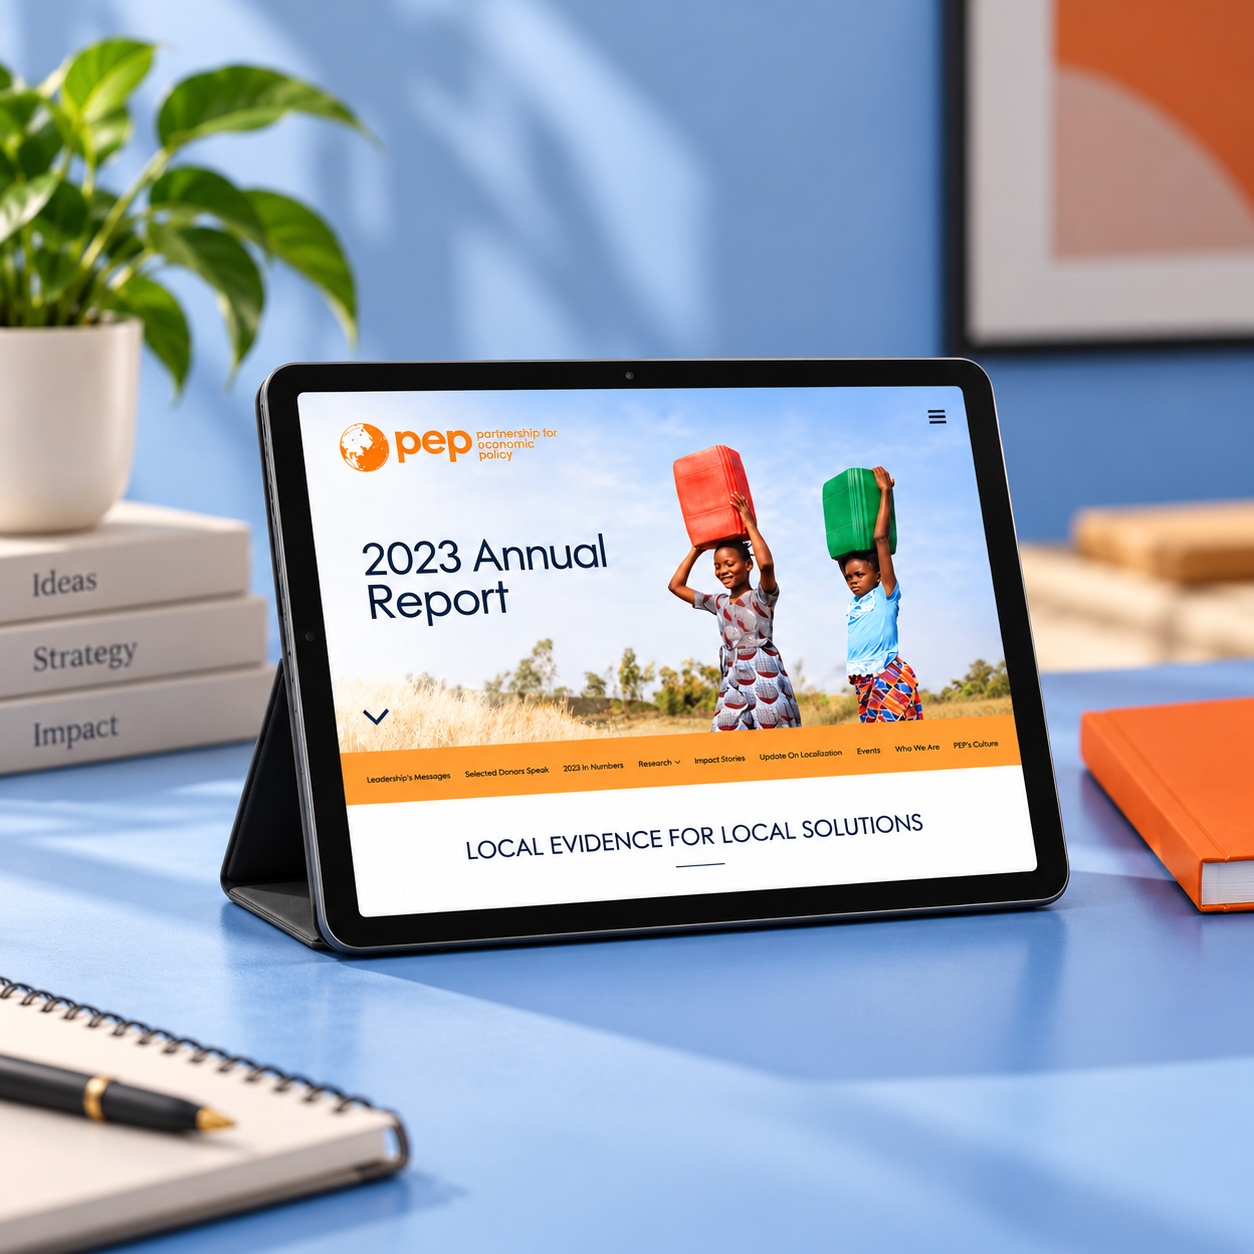
An interactive annual report website for PEP, bringing organisational achievements, data and impact stories together through clear navigation and digital storytelling.
Overview
Webbies developed PEP’s digital annual report website to turn organisational reporting into a browsable online experience. The portfolio identifies interactive data and impact visualisation, visual storytelling and report navigation as the core scope.
An annual report combines several kinds of information: achievements, key insights and accounts of the work behind them. The project brings these materials into a common reading experience, allowing visitors to explore sections and individual stories rather than follow only one continuous document.
The supplied project presentation shows a 2023 annual report. This case study concerns the website experience documented in the portfolio; it does not independently verify the report’s statistics or claim changes in readership, engagement or organisational impact.
Specifications
- Client
- PEP
- Deliverable
- Digital annual report website
- Presentation reference
- 2023 annual report
- Scope
- Storytelling, data visualisation and report navigation
- Services
- Web design · Digital storytelling · Development
Features
Achievements as digital stories
The report presents organisational achievements through visual storytelling. Individual stories give readers a route into the work behind the wider annual overview.
Data and impact visualisation
Interactive presentation is part of the documented scope for communicating data and impact. The website is the presentation layer; this case study does not make new claims about the figures it contains.
Report navigation
Clear sections help readers choose where to begin and move between topics. This supports both an overview of the year and closer reading of a particular area.
A connected reading experience
Content, visuals and navigation work together within the web format. The project brings report material into an experience visitors can explore at their own pace.
Architecture
This functional view describes how report content reaches the reader. The portfolio does not specify the CMS, analytics stack or data integrations.
Report material
Achievements, key insights and impact information supply the editorial content.
Presentation
Visual storytelling and interactive data presentation shape the reading experience.
Navigation
Sections and story routes connect readers with the material relevant to them.
Explore further
Have a similar challenge?